EMTP statistical calculations for cables
To protect the transformer from lightning surges, the metal-oxide arrester (MOA) is often placed directly at its bushings, at a distance of no more than 2-3 m. This creates an impression that the transformer will be fine. In fact, this is a false impression, and the effect on the windings depends not only on the surge value (which, of course, with such an installation of MOA will be formally acceptable), but also on the number of impacting waves. This means that calculations of lightning processes are statistical, taking into account the design features of connected overhead lines (OHL). However, there is a lack of such calculations in the world.
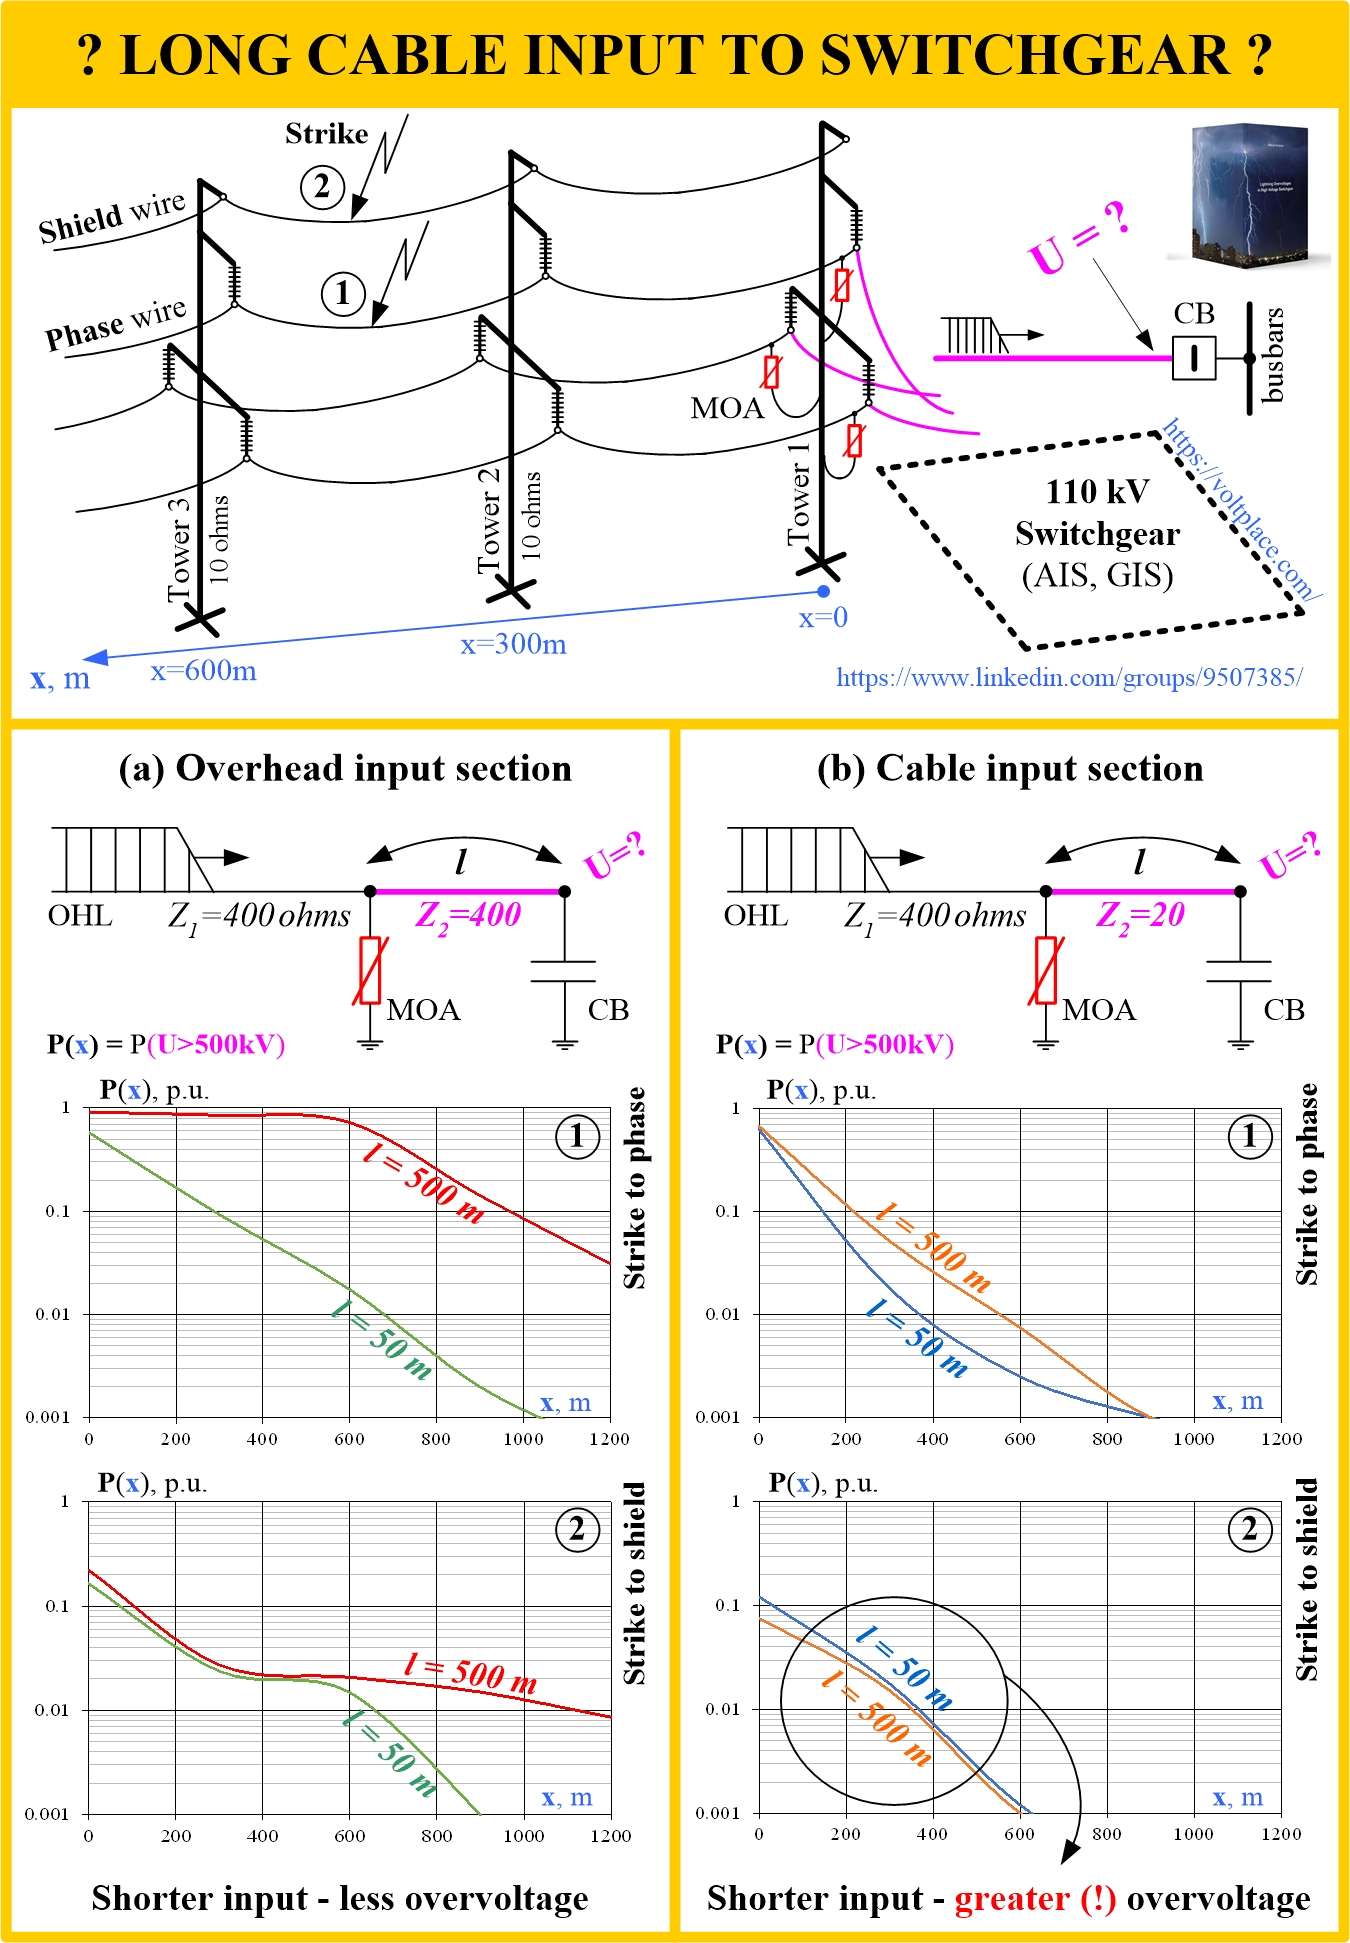
Suppose we have an OHL that needs to be connected to a switchgear:
✔️ (a) – by air-insulated input section.
✔️ (b) – by cable input section.
In such cases, the question arises, is the MOA installed on the transition tower (tower No.1) sufficient to protect the open circuit breaker (CB)? Or should we put another MOA at the CB to protect the CB and, in case of cable section, a cable termination there? Savings on such an additional MOA would be great, especially for SF6-insulated switchgear (GIS).
Let us make statistical calculations for 110 kV, for lengths of connection of 50 and 500 meters. All lightning strikes are divided into two groups:
1️⃣ to phase wires (break through shield).
2️⃣ to shield wire (most realistic case).
The graphs show how, as the lightning strike site moves away from the transition tower (No.1), the probability of a voltage surge of more than 500 kV on the CB (or on the cable termination) decreases (where 500 kV – is the permissible level for the 110 kV class). The area under the curve is an important characteristic of the equipment’s protection against overvoltage. The smaller the area, the less likely it is that the equipment will be damaged in case of lightning. Next, this area can be multiplied by the number of lightning strikes per 1 km of the OHL length, and this will give the annual number of dangerous cases, but today we will not do this.
What do we see from graphs? We can see that for the air section, the longer the section from the transition tower to the open CB, the greater the probability of a dangerous event. However, the situation is different for the cable section, and we see two important features:
✅ In case of strikes to phase, the longer the cable, the greater the risk for open CB and cable termination (however, areas under curves are almost the same).
✅ In case of strikes to shield, the longer the cable, the LESS risk.
We can see, even long cable inputs can be protected with just one MOA on the transition tower (No.1). A long cable section protects itself !
One day I’ll make a post about statistical calculations of processes in the screen cross-bonding node, about the length of bonding cables. Because CIGRE’s recommendations are incorrect.
If you would like to learn more about statistical calculations of processes in EMTP, then let me please recommend you a new brochure “Lightning Overvoltages in High Voltage Switchgear“. It describes the methodology and provides examples of calculations for an air-insulated switchgear.